You are reading the book Wicked Problems, published by Jon Kolko in 2011.
Methods for Planning a Business
Revenue and Expense Worksheet
What is it?
Designing in the context of wicked problems requires a long-term, interdisciplinary mindset. An organization that focuses on them needs to exist for years before it can begin to truly claim to realize the impact of their work. Running a company successfully for years requires financial acumen and operational self-sufficiency, so these become fundamental principles for social entrepreneurship.
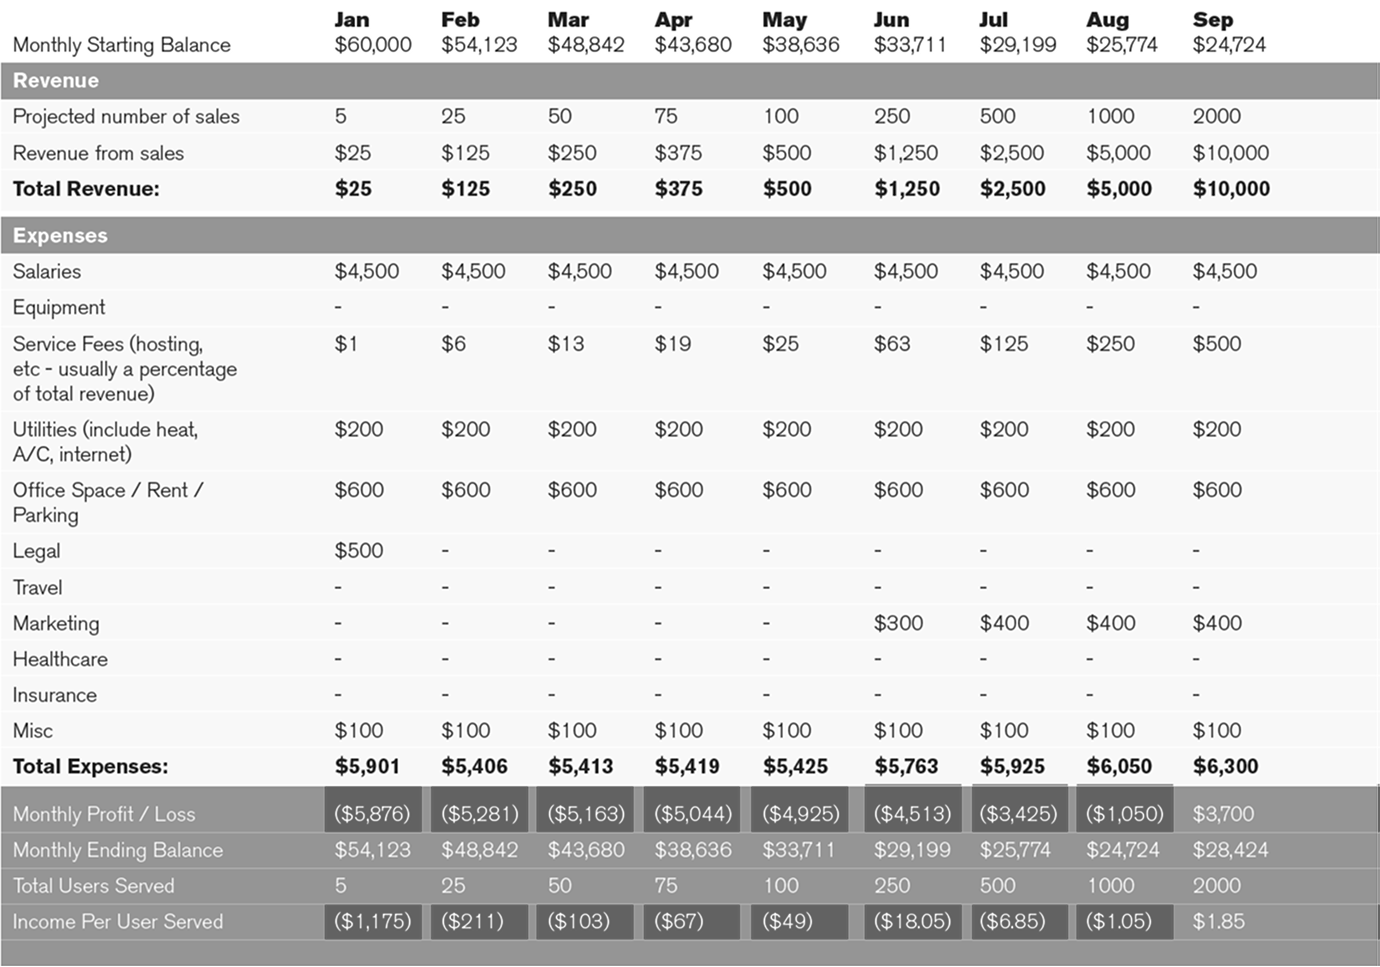
All forms of financial worksheets track money coming into the business and money flowing out of the business, and determine the difference. A revenue and expense worksheet is used to understand, track, and strategically plan a company's financial stability. It tracks revenue, profit, and expenses, and helps you determine how much you can afford to pay in salaries, how many employees you can afford to support at any given time, and how much you might charge for your services.
For example:

How do I do it?
Use the worksheet below to gain a broad view of your finances. (Note that it doesn't include things like tax breaks or other more advanced forms of financial reporting and planning). To fill out the worksheet, start by identifying the major expenses your company incurs. These usually include the following:
- salaries: How much will you pay yourself and everyone else that works with and for you? List these on a monthly basis.
- physical space: Do you need to rent a facility? How much is monthly rent?
- equipment, such as laptops or projectors.
- utilities, such as internet access.
- research costs, such as compensation for participants
Now identify the repeating revenue from expected sales. How much can you charge for your product or service? For example, will people be willing to pay $9.99 a month? $12.99? $19.99? How do you know? And, how big is your entire market? Be conservative when you estimate it because not everyone is a likely candidate for your product. For example, if you define your market as "U.S. college students," you might estimate its size as 30 million. What percentage of this market will be aware—through advertising, marketing, and word of mouth—that your product exists? And what percentage of the people who are aware of your product will actually buy it? An appropriate estimate for a consumer product at a low price point is 5%. So if 5% of the 30,000 people buy, you've made 1,500 sales.
You've identified your monthly "revenue upside"—the most revenue you can expect to bring in each month from that revenue stream.
Identify other sources of revenue, and map the repeating revenue on a monthly basis:
- Consider seed or initial funding. Did you and each of your partners add some amount of money? Have you raised any grant or venture capital?
- Project how your monthly revenue will change as you reach more people through your successes.
You've now established a framework for thinking about revenue and expenses. You know how much you expect to pay per month as expenses, and you can anticipate what you will bring in each month in revenue.
Note that the example above makes the following assumptions:
- 3 employees, each making $1,500 per month, have each contributed $20,000 in seed funding
- There are no equipment costs
- A service is offered at $5 per month, per customer
- The total market size is 250,000 people
- During June, 5% of that market size is reached through advertising (12,500 people), and 2% of those reached through advertising transact (250 people)
When should I use it?
Create an initial revenue and expense worksheet when you understand who your target market is and what your product or service is. Then continue to revise and refine this model as you operate your business. You'll probably find that your initial estimates were wrong, and you'll be able to replace them with actual historic transactional data to better inform and predict the future of your business.
What is the output, and how can I use it?
The most obvious output of the revenue and expense worksheet is a single per-month profit-and-loss figure—an indication of profitability. But the worksheet provides more useful data than just this simple number. For example, the worksheet defines expectations in served users and reached populations to begin to illustrate your expectations of growth and publicity. It also defines your assumptions about a given market's size, and—over time—tells you whether you were correct. And it helps you realize how changes in product and service pricing can support or hinder your company's operational self-sufficiency.
Where can I download this worksheet?
You can download this worksheet as an Excel file here.
Where can I learn more?
A brief description of forecasting revenue is available at www.entrepreneur.com/article/76418
